The Office of Energy and Sustainability updated the City’s municipal
and community-wide greenhouse gas (GHG) emissions inventories for 2019. The
goal of the inventory update was to measure progress towards achieving emissions
reduction goals set previously and to identify key sources of GHG emissions.
The GHG inventories will be used to develop high-impact climate change mitigation
strategies for the future.
Greenhouse Gas
Emissions Inventory Results for 2019:

The 2019 GHG inventory assesses
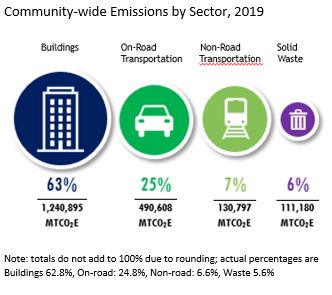
emissions by sector (e.g., Buildings, Transportation, Solid Waste) and by
source (e.g., electricity, natural gas). The highest sources of emissions from
both Rochester’s community activities and municipal operations were from the
energy used in buildings and the fossil fuels burned for transportation. Other
sources included waste generation, non-road transportation, wastewater
treatment, and energy use for water treatment and delivery.
To download a brief slideshow
overview of the inventory report, please click here.
To download the full report of
the municipal and community-wide greenhouse gas inventories, please click here.
Municipal GHG
emissions
The City’s first Municipal Operations GHG inventory was completed
in 2011 with the goal of reducing greenhouse gas emissions by 20% by 2020 from
a 2008 baseline.
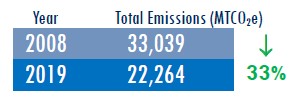
The 2019 inventory showed that municipal GHG
emissions reduced by 33%


Community-wide GHG emissions
Community-wide inventory completed in 2017. Goal to reduce
greenhouse gas emissions by 20% by 2020 and by 40% by 2030 from a 2010 baseline.
The 2019 inventory showed that community-wide GHG emissions
reduced by 10%

Background
GHGs are naturally occurring compounds that
accumulate in the atmosphere, trapping heat and regulating the Earth’s
temperature. However, when fossil fuels (like natural gas, coal, and gasoline)
are burned or when materials in landfills decompose, the level of GHGs in the
atmosphere increases and heat that would normally escape into space is trapped
and reflected to earth. This “Greenhouse Effect” has caused an increase
in the global average temperature as well as more local extreme weather events
and climate hazards already being experienced in New York and Rochester.
This GHG emissions inventory includes three primary
GHGs—carbon dioxide (CO2), methane (CH4), and nitrous oxide (N2O)—organized by
sector and source. GHGs are typically reported in units of CO2 equivalents, or
CO2e. This accounting convention normalizes the relative amount of warming
produced by different gases with the use of global warming potential (GWP)
multipliers. For the non-CO2 gases, CH4 and N2O, calculations use GWP values
from the Intergovernmental
Panel on Climate Change (IPCC) 5th Assessment Report assessed over a 100-year time horizon.
The data used to generate regional GHG emissions
estimates were drawn from local and national sources that capture and report
activity data from multiple sectors across the city. For more information about
specific data sources, please refer to the Methodology section at the end of
the report.
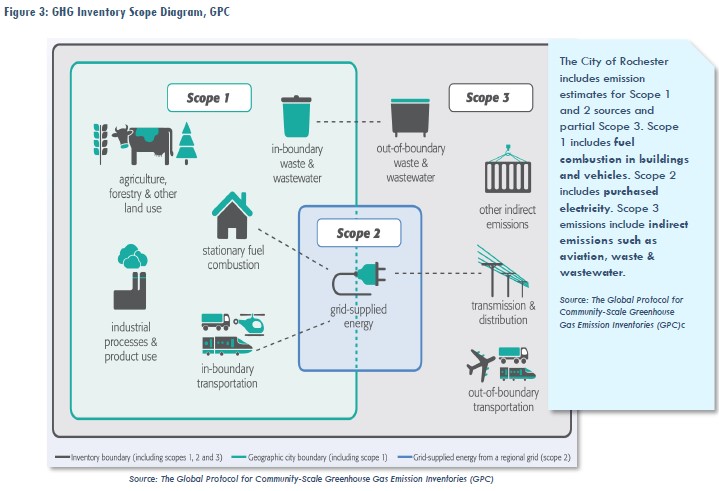
The City of Rochester includes emission estimates
for Scope 1 and 2 sources and partial Scope 3. Scope 1 includes fuel combustion
in buildings and vehicles. Scope 2 includes purchased electricity. Scope 3
emissions include indirect emissions such as aviation, waste & wastewater.

Looking Forward
- This
inventory shows that the City has surpassed our municipal emissions
reduction goal by 13%. This can be attributed to the City’s commitment and
efforts to promote energy efficiency, including but not limited to City
facility energy efficiency upgrades, LED street lights, adoption of more
efficient fleet vehicles and solar energy generation.
- Although
community emissions have not reduced as quickly, Rochester did see
reductions from its commercial buildings.
- Other
recent mitigation actions have been implemented since the completion of
the Community-wide Climate Action Plan in 2017 but the inventory year of
2019 does not account for all of them. For example, the City’s Community
Choice Aggregation was launched in 2021 and is not represented in the 2019
emissions inventory update. More time is needed to see the impacts of
other community-wide climate change mitigation actions.
- A
substantial challenge lies ahead in Rochester and many communities to
transform the way we heat and cool our buildings and fuel our vehicles. We
need to work together to transition to carbon-free electricity to fuel our
buildings and transportation sectors.
- Both
at the state level through the New York Climate Leadership and Community
Protection Act and from the federal Inflation Reduction Act of 2022,
Rochester is well positioned to accelerate progress and maintain a
leadership position in the transition to a climate-friendly and resilient
community.
Questions?
Please contact Shalini Beath in the City’s Office of Energy and Sustainability at (585) 428-6939 or email her.
Funding
Acknowledgement
This
project has been funded in part by The Climate Smart Community Grant Program,
Title 15 of the Environmental Protection Fund through the NYS Department of
Environmental Conservation.